GREEN
Mapped: Human Impact on the Earth’s Surface

Published 16 hours ago
on October 15, 2021
By Nick Routley
Mapped: Human Impact on the Earth’s Surface
With human population on Earth approaching 8 billion (we’ll likely hit that milestone in 2023), our impact on the planet is becoming harder to ignore with each passing year.
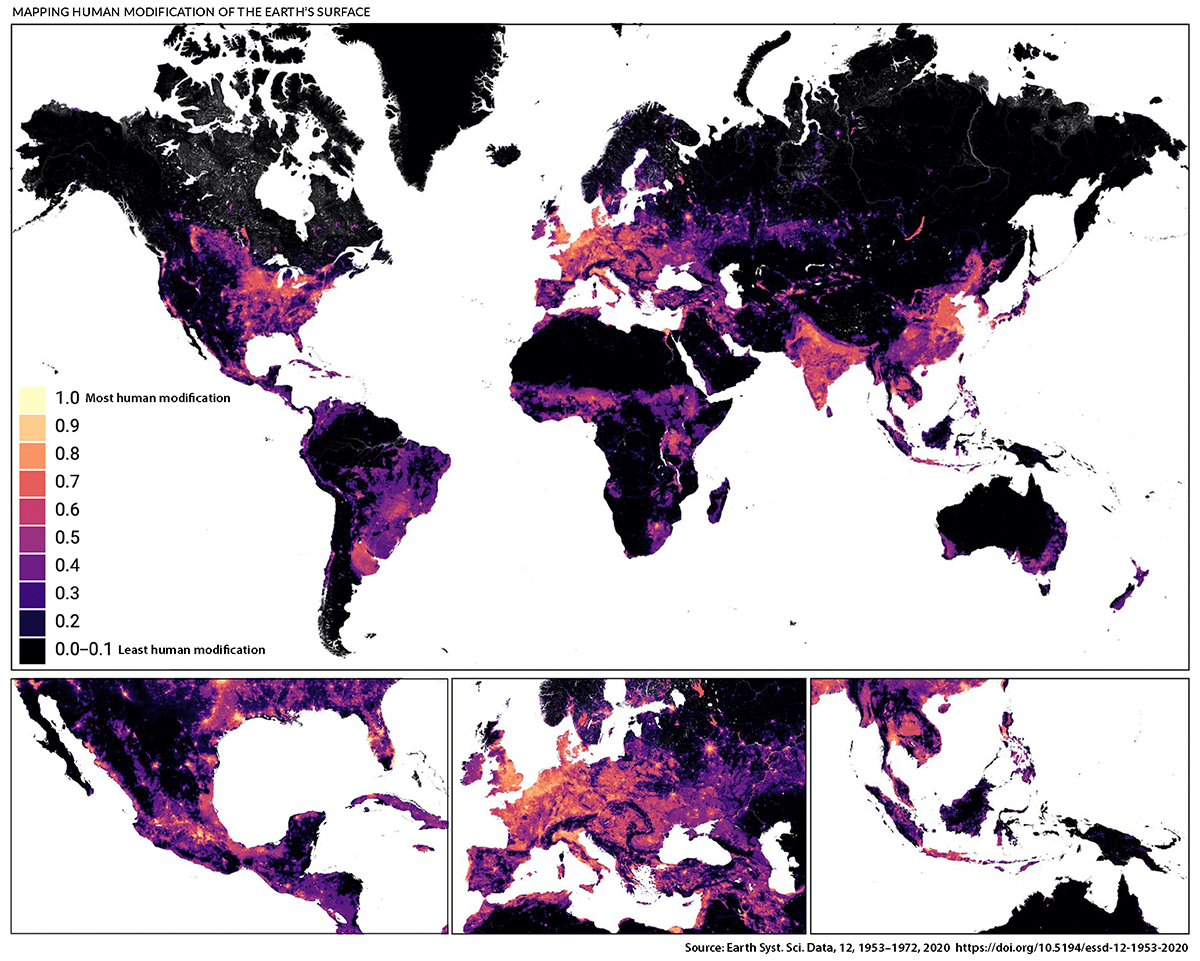
Our cities, infrastructure, agriculture, and pollution are all forms of stress we place on the natural world. This map, by David M. Theobald et al., shows just how much of the planet we’ve now modified. The researchers estimate that 14.6% or 18.5 million km² of land area has been modified – an area greater than Russia.
Defining Human Impact
Human impact on the Earth’s surface can take a number of different forms, and researchers took a nuanced approach to classifying the “modifications” we’ve made. In the end, 10 main stressors were used to create this map:
- Built-Up Areas: All of our cities and towns
- Agriculture: Areas devoted to crops and pastures
- Energy and extractive resources: Primarily locations where oil and gas are extracted
- Mines and quarries: Other ground-based natural resource extraction, excluding oil and gas
- Power plants: Areas where energy is produced – both renewable and non-renewable
- Transportation and service corridors: Primarily roads and railways
- Logging: This measures commodity-based forest loss (excludes factors like wildfire and urbanization)
- Human intrusion: Typically areas adjacent to population centers and roads that humans access
- Natural systems modification: Primarily modifications to water flow, including reservoir creation
- Pollution: Phenomenon such as acid rain and fog caused by air pollution
The classification descriptions above are simplified. See the methodology for full descriptions and calculations.
A Closer Look at Human Impact on the Earth’s Surface
To help better understand the level of impact humans can have on the planet, we’ll take a closer look three regions, and see how the situation on the ground relates to these maps.
Land Use Contrasts: Egypt
Almost all of Egypt’s population lives along the Nile and its delta, making it an interesting place to examine land use and human impact.
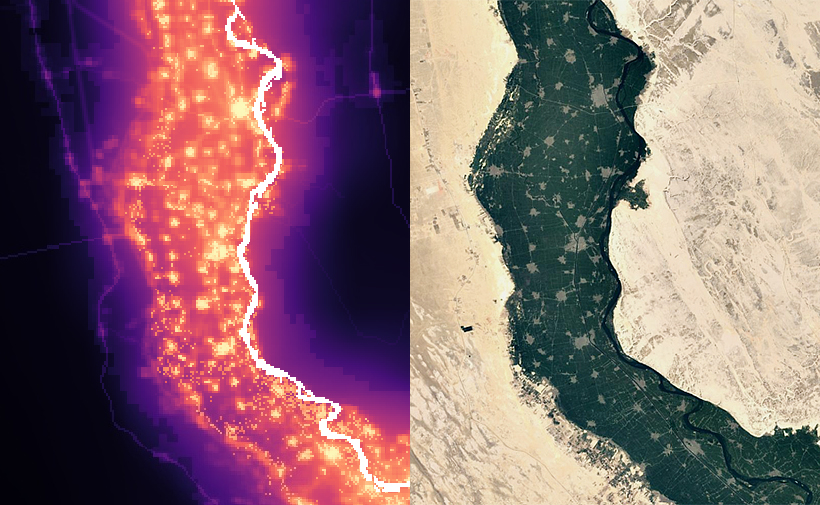
The towns and high intensity agricultural land following the river stand out clearly on the human modification map, while the nearby desert shows much less impact.
Intensive Modification: Netherlands
The Netherlands has some of the heavily modified landscapes on Earth, so the way it looks on this map will come as no surprise.
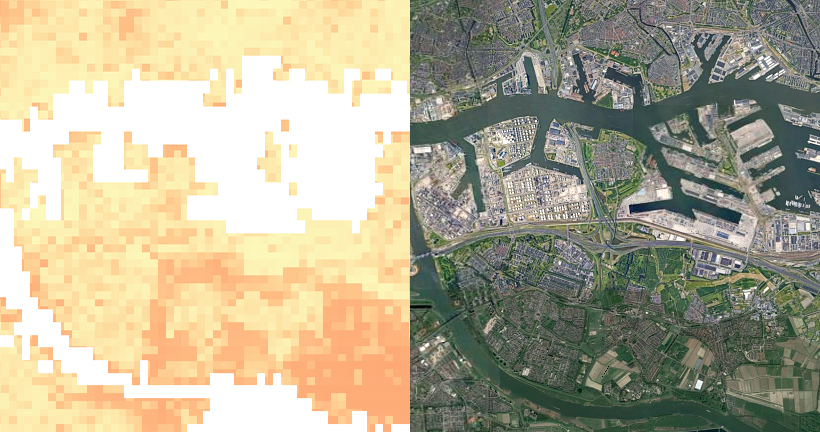
The area shown above, Rotterdam’s distinctive port and surround area, renders almost entirely in colors at the top of the human modification scale.
Resource Extraction: West Virginia
It isn’t just cities and towns that show up clearly on this map, it’s also the areas we extract our raw materials from as well. This mountainous region of West Virginia, in the United States, offers a very clear visual example.
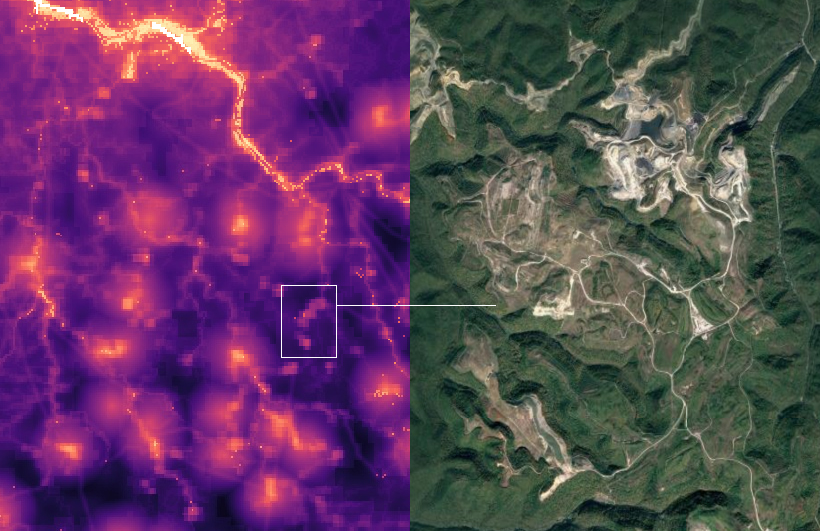
The mountaintop removal method of mining—which involves blasting mountains in order to retrieve seams of bituminous coal—is common in this region, and mine sites show up clearly in the map.
You can explore the interactive version of this map yourself to view any area on the globe. What surprises you about these patterns of human impact?

Mapped: Human Impact on the Earth's Surface (visualcapitalist.com)
Mapped: Human Impact on the Earth’s Surface
This detailed map looks at where humans have (and haven't) modified Earth's terrestrial environment. See human impact in incredible detail.
www.visualcapitalist.com
'스크랩' 카테고리의 다른 글
| Help Me Make It Through The Night (0) | 2021.10.17 |
|---|---|
| ?이제 암 걱정 끝? (0) | 2021.10.17 |
| Jazzy Beats ? Rainy Window - Lofi Hip Hop Jazz Music to Relax, Study, Work and Chill (0) | 2021.10.16 |
| "과식은 중독"…계속 과식하는 메커니즘의 비밀[최지원의 사이언스 톡(talk)] (0) | 2021.10.16 |
| DATASTREAMCharting the Continued Rise of Remote Jobs (0) | 2021.10.16 |