DATASTREAM
Tax-to-GDP Ratio: Comparing Tax Systems Around the World

Published 2 hours ago
on July 28, 2021
By Carmen Ang
The Briefing
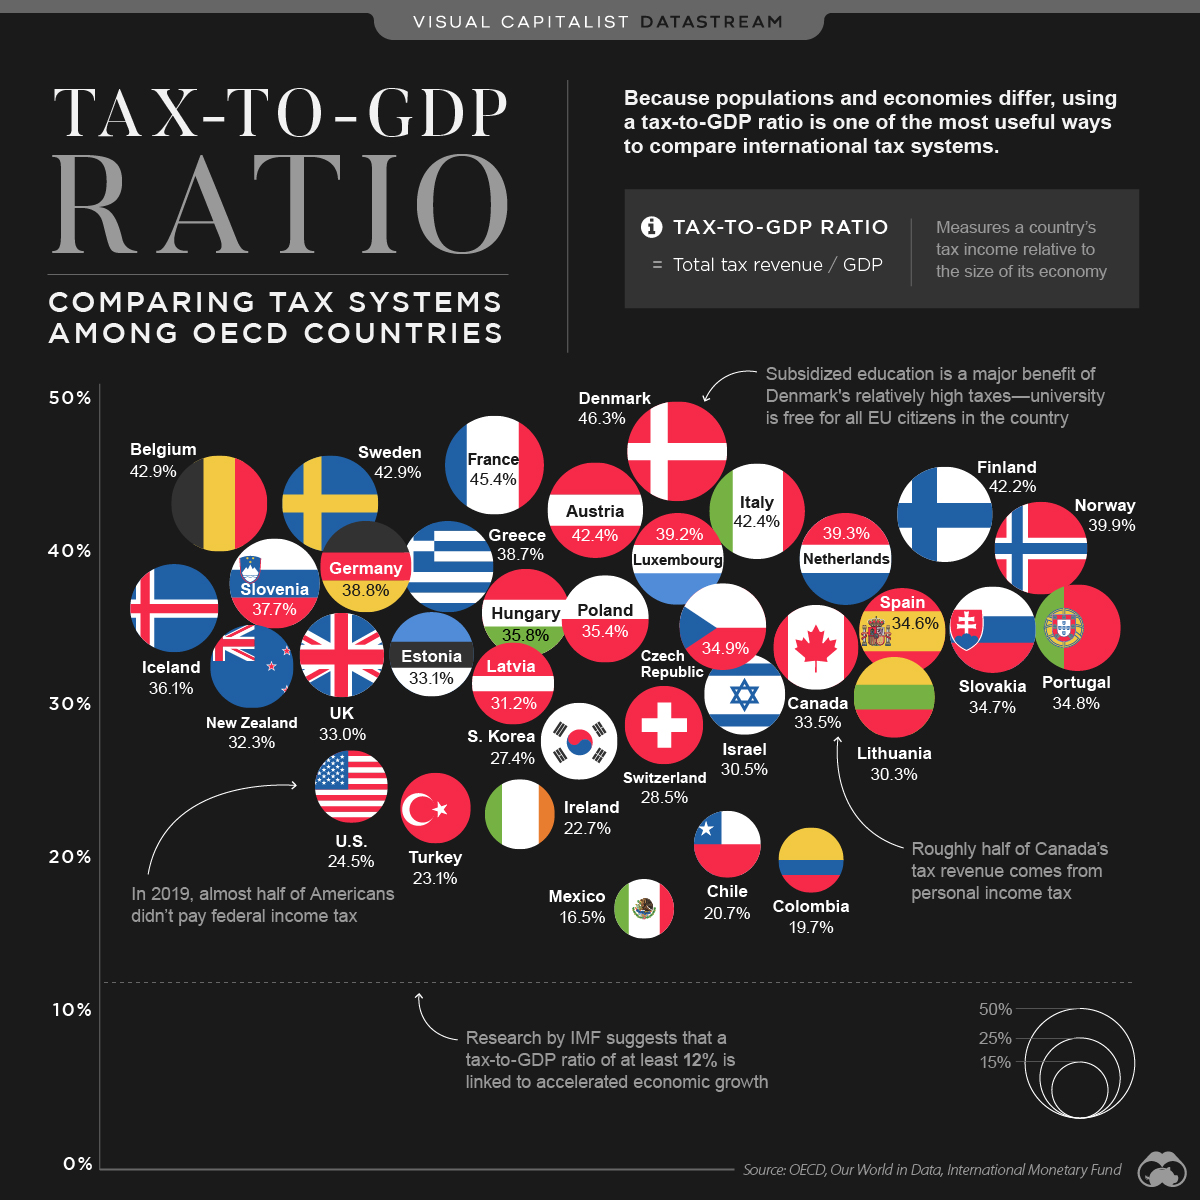
- The tax-to-GDP ratio measures a country’s tax revenue, relative to the size of its economy (measured by its Gross Domestic Product, or GDP)
- A higher tax-to-GDP ratio means more money is going to government coffers, and in theory, public services like education and infrastructure
- Out of 35 OECD countries, Denmark has the highest tax-to-GDP ratio at 46.3%, while Mexico ranks last at 16.5%
Tax-to-GDP Ratio: Comparing Tax Systems Around the World
Taxes are an important source of revenue for most countries. In fact, taxes provide around 50% or more of government funds in almost every country in the world.
How does each country’s tax system compare to one another? This question is tricky to answer. Since countries’ populations and economies differ greatly, measuring total tax revenue is not the best way to compare international tax systems.
Instead, using a tax-to-GDP ratio is one of the more useful ways to compare tax systems around the world.
What is the Tax-to-GDP Ratio?
The tax-to-GDP ratio compares a country’s tax revenue to the size of its economy, which in this case is measured by its GDP.
The higher the ratio, the higher the proportion of money that goes to government coffers. If managed effectively, this can support the long-term health and prosperity of an economy. According to research conducted by the International Monetary Fund, countries should have a tax-to-GDP ratio of at least 12% in order to experience accelerated economic growth.
The countries that are part of the Organisation for Economic Co-operation and Development (OECD) all meet that threshold, with an average tax-to-GDP ratio of 33.8%.
Ranked: The Tax-to-GDP Ratios of OECD countries
The dataset used for this graphic looks at 35 of the 37 OECD countries, since recent data for Australia and Japan was not available.
Search:
RankCountryTax Revenue as % of GDPOECD Average33.8%
| 1 | Denmark | 46.3% |
| 2 | France | 45.4% |
| 3 | Belgium | 42.9% |
| 4 | Sweden | 42.9% |
| 5 | Austria | 42.4% |
| 6 | Italy | 42.4% |
| 7 | Finland | 42.2% |
| 8 | Norway | 39.9% |
| 9 | Netherlands | 39.3% |
| 10 | Luxembourg | 39.2% |
Showing 1 to 10 of 35 entries
At 46.3%, Denmark has the highest ratio on the list. The country puts its relatively high tax revenue to use, particularly when it comes to subsidizing post-secondary education—in Denmark, university is free for all EU citizens.
On the less-taxed end of the spectrum, the U.S. ranks 30 out of 35, with a ratio of 24.5%—that’s notably lower than the OECD average of 33.8%. It’s also worth mentioning that the U.S. has one of the highest GDP per capita measures out of all OECD countries.
Where does America’s tax revenue come from? It gains most of its revenue from the personal income tax. In fact, 41% of the country’s total tax revenue comes from taxes on personal income, as well as individual profits and gains—for context, the OECD average is 24%.
With President Biden’s recent announcement to increase corporate taxes and personal investment gains, America’s ratio could look a lot different in the near future.
>>Like this? You might find this article interesting, Unequal State Tax Burdens Across America
Where does this data come from?
Source: OECD
Details: This source uses 2019 provisional data to calculate each country’s tax-to-GDP ratio. For more information on methodology, read the full report by clicking here.

Tax-to-GDP Ratio: Comparing Tax Systems Around the World (visualcapitalist.com)
Tax-to-GDP Ratio: Comparing Tax Systems Around the World
Using the tax-to-GDP ratio, we compare the tax systems of 35 OECD countries. See which nations have the highest and lowest rates.
www.visualcapitalist.com
'스크랩' 카테고리의 다른 글
| 한국선 CEO 법정행 각오해야 한다는 참담한 미국 보고서 [오정근의 경제산책] (0) | 2021.07.29 |
|---|---|
| "소인배는 "미안합니다" ? 라는 말을 하지 못한다. (0) | 2021.07.29 |
| 삿자리 임금/ 㰔主 (0) | 2021.07.28 |
| ??99 88!! 건강하게 사는 법!! (0) | 2021.07.28 |
| 인연이란 (0) | 2021.07.28 |